This is a stunning rate of temperature rise. Half a degree per decade. If temperatures continue to rise at this rate, the 2090s will average 4.5°F warmer than the 2000s, and 6°F warmer than the 1970s! And the temperature rise will almost certainly not remain constant. Due to humanity's accelerating consumption of fossil fuels, carbon dioxide concentrations in the atmosphere will accelerate their rise and temperature rises will almost certainly accelerate as well. 0.5°F/decade almost certainly represents an underestimate of how much temperatures will increase during the 21st century.
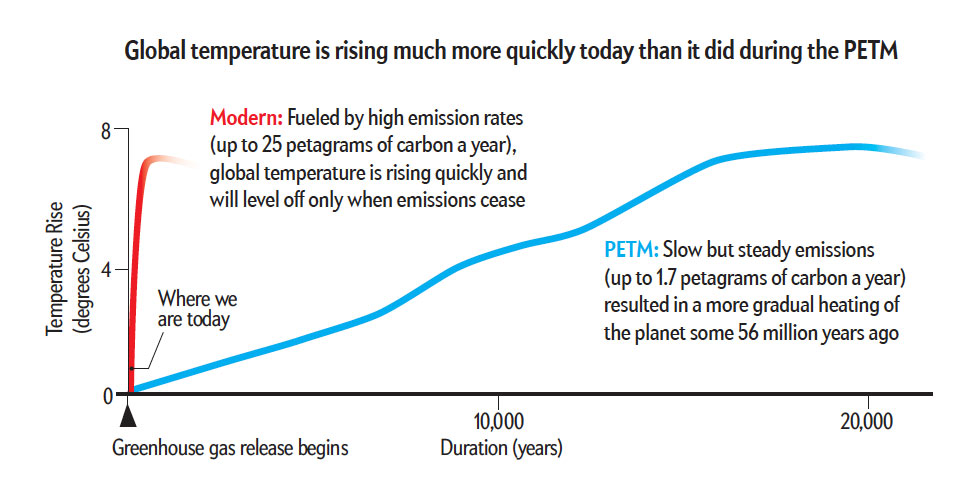
Humanity has never lived in such a rapidly warming environment. Ever. Nothing comes close in our planet's history except for the Paleocene–Eocene Thermal Maximum (PETM)
The PETM was a huge warming triggered by mass releases of carbon dioxide and methane from the oceans 55.8 million years ago. Temperatures soared by more than 5°C from what was already a warmer environment than the present. The average temperature at the North Pole was 73°F, comparable to Miami. For tens of thousands of years there was not one snowflake. Not one floe of ice. No frost. Anywhere.
So how does our present addition of carbon dioxide to the atmosphere compare to what happened during the PETM? Much research has been done in the last decade, and the scope of carbon releases during the PETM, and their speed compared to our own time has become clear.
And the comparison is not good.
Here is a graph showing carbon releases into the atmosphere. Our current additions of carbon to the atmosphere are already more than 5 times greater than during the PETM, and are continuing to accelerate as the developing world industrializes, and the developed world does very little. Projections show that our carbon emissions will nearly triple, to 15 times the carbon emission rates of the PETM.
Graph of net carbon emissions into the atmosphere from Scientific American:
And a sediment core sample showing the PETM:

Some highlights from Dr. Kump's article:
Until recently, though, open questions about the event have made predictions speculative at best. New answers provide sobering clarity. They suggest the consequences of the planet’s last great global warming paled in comparison to what lies ahead, and they add new support for predictions that humanity will suffer if our course remains unaltered.
But what surprised us most was that this gas release was spread out over approximately 20,000 years—a time span between twice and 20 times as long as anyone has projected previously. That lengthy duration implies that the rate of injection during the PETM was less than two petagrams a year—a mere fraction of the rate at which the burning of fossil fuels is delivering greenhouse gases into the air today. Indeed, CO2 concentrations are rising probably 10 times faster now than they did during the PETM.
But what surprised us most was that this gas release was spread out over approximately 20,000 years—a time span between twice and 20 times as long as anyone has projected previously. That lengthy duration implies that the rate of injection during the PETM was less than two petagrams a year—a mere fraction of the rate at which the burning of fossil fuels is delivering greenhouse gases into the air today. Indeed, CO2 concentrations are rising probably 10 times faster now than they did during the PETM.
Species extinctions are on the rise, and shifting climate zones have already put surviving plants and animals on the move, often with the disease-bearing pests and other invasive species winning out in their new territories. Unlike those of the PETM, modern plants and animals now have roads, railways, dams, cities and towns blocking their migratory paths to more suitable climate. These days most large animals are already penned into tiny areas by surrounding habitat loss; their chances of moving to new latitudes to survive will in many cases be nil.
Current global warming is on a path to vastly exceed the PETM, but it may not be too late to avoid the calamity that awaits us. To do so requires immediate action by all the nations of the world to reduce the buildup of atmospheric carbon dioxide—and to ensure that the Paleocene-Eocene Thermal Maximum remains the last great global warming.
I have to disagree with Dr. Kump in the last extract from his article. Calamity does await us. The scientific community has known for almost 50 years that our fossil fuel emissions will warm the atmosphere. And yet next to nothing has been done. During the 1970s we had our best chance of limiting fossil fuel emissions during the first energy crisis. We made some cosmetic changes, but no real reforms. During the 1980s we slept through the soothing lullaby of the Reagan administration's neglect of environmental issues. During the 1990s Clinton triangulated away any meaningful environmental and energy reforms, and failed to provide any leadership on the Kyoto Protocol. The second Bush administration's hostility to environmental and energy reforms has been told in many long accounts, and requires no further comment by me.
And now we have Tea Party fanatics who would rather send the Earth straight to hell than acknowledge scientific reality, blocking any reforms to increase energy efficiency, or environmental protection. The Tea Party fanatics even want to reduce study and research about Global Warming!
We've never missed an opportunity to miss an opportunity.
I don't see how we can avoid calamity. It's not just the USA--cheap, carbon rich coal is powering the development of China--lip service is paid there to global warming, and greenwashing in China may be more prevalent than in any other country. India, South America, and even Africa are expanding their fossil fuel consumption rapidly. Coal is cheap, almost everywhere, and the worst thing we can consume. Short term thinking conquers all.
It makes me sad. I live on a beautiful barrier island, St. Simons Island with my partner. It is beautiful, a great place to grow up and a great place to live.
By 3000 CE, all of this will be gone. My house and island will be under a warm, acid sea, so deep that the sun will be only faintly visible. Rising to the surface, no land will be visible. The same will be true for land where billions of people live now, and where billions get their crops and foodstuffs from. And we're doing nothing to stop it. And with the current trajectory of carbon emissions, and our refusal to face the situation squarely, the remaking of our fair planet into an acidic, hot, steambath of a world seems inevitable.
The concept of culturing livestock with this bacterium to reduce methane emissions is interesting: http://www.bbc.co.uk/news/science-environment-13946941
ReplyDeleteCensus bureau has revised upwards its estimate of current world population by 19 million. If valid, this will make it that much harder to control our greenhouse gas emissions and other impacts on the environment.
ReplyDeleteWhat do you think of this:
ReplyDeleteReconciling anthropogenic climate change with
observed temperature 1998–2008
We find
that this hiatus in warming coincides with a period of little increase
in the sum of anthropogenic and natural forcings. Declining solar
insolation as part of a normal eleven-year cycle, and a cyclical
change from an El Nino to a La Nina dominate our measure of
anthropogenic effects because rapid growth in short-lived sulfur
emissions partially offsets rising greenhouse gas concentrations.
As such, we find that recent global temperature records are consistent
with the existing understanding of the relationship among
global surface temperature, internal variability, and radiative
forcing, which includes anthropogenic factors with well known
warming and cooling effects.
http://thinkprogress.org/wp-content/uploads/2011/07/pnas-1998-2008.pdf
If there was a slowdown in warming recently, it was only temporary, as in no longer present, if you look at the 10 year running mean from GISS (change mean period to 120 months and set start as 1980); this suggests that ENSO and solar variation was most likely the cause, moreso than increases in aerosols, given the 1998 El Nino and 2008 La Nina and the ~7 years of warming that would be offset by a prolonged (including a permanent) solar minimum, as explained by Hansen in 2008 (according to Spaceweather.com, 2004 was the start of the most recent minimum, or first spotless day, with the last early this year, so about 6-7 years passed).
ReplyDeleteOf interest also is that ice volume anomaly has gone lower than it did last year:
ReplyDeletehttp://neven1.typepad.com/blog/2011/07/piomas-june-2011.html
Also, another thing - the greater warming over the Arctic in recent years (compared to the global average) means that datasets that don't attempt to include the Arctic will show less overall warming, especially if weather patterns are causing faster warming in the Arctic at the expense of lower latitudes. In fact, that is exactly what is happening in the Northern Hemisphere - there has been little or no warming in the NH mid-latitudes since about 1995, after rapid warming since 1970, while Arctic warming has accelerated, particularly since 2000 (by contrast, in the SH, both the mid-latitudes and Antarctic are warming at more or less the same rate since 1980).
http://www.columbia.edu/~mhs119/Temperature/T_moreFigs/
See regional changes section about 2/3 of the way down the page.
Michael thanks for the links! I've been busier than I like during the past few days so haven't had a chance to go over them until today.
ReplyDeleteThe lack of warming in the mid latitudes as compared to the arctic has been most unfortunate as it affects public opinion. Even so, in the USA the 2000s were much warmer than the 1970s, and I expect that every revision of the 30 year climatic normals will show an increase in average temperatures in the USA.
That will also cause confusion though. 97 degrees in St. Louis on July 4th 2096? But it's 2 degrees below normal! That proves global warming isn't happening! That's what the skeptics will say then.
I've been reading about how lead mining and manufacturing in industry (a much smaller industry than the fossil fuel industry) tenaciously fought the reduction and elimination of lead in gasoline and paint.
http://www.amazon.com/Deceit-Denial-Politics-Industrial-Pollution/dp/0520217497
Well worth a read. Lead poisoning was well documented as far back as 1713 in Italy, and to this day companies that mine and use lead in products continue to deny lead is poisonous!
The Global Warming denier mouthpieces are far more well-funded. I suspect that they will keep us from effective solutions to the global warming crisis until it is too late. Which it probably is already.
A little good news: http://www.bbc.co.uk/news/science-environment-14030849
ReplyDeleteAccording to Roy Spencer's daily satellite data, 2011 has now caught up to 2010 (channel 5) and has been much warmer than 2009 for the past month. That is especially interesting since there isn't any indication of a trend towards El Nino yet (it now looks like the progression of ENSO will be similar to 2008; unfortunately that means that the deniers will have another reason to make fun of Hansen - although he is often too quick to say that an El Nino is coming, as also happened in 2006, although there was an El Nino but not a strong one).
ReplyDeleteAntarctic sea ice area is currently 738,000 square kilometers below average, and 2.5 million km2 below last year, which is also half of the Arctic SIA anomaly (-1.514), for a combined global anomaly of 2.25 million km2 below average - near the largest such departure on record.
ReplyDeletehttp://arctic.atmos.uiuc.edu/cryosphere/
Another look at how anomalously low sea ice is, not sure if the Antarctic is at a record low (1986 has the current record for July, note that all of the years shown in the link below were above average for July):
http://www.iup.uni-bremen.de:8084/amsr/
Also, a commenter in Neven's blog (linked previously) mentioned that Resolute (located along the NW Passage) had an all-time record high of 18.7°C the other day.
Michael,
ReplyDeleteThanks for your links!
The Resolute record high temperature is interesting.....as is the pressure pattern. The arctic dipole is in full swing, and it's not clear whether the increased frequency of the arctic dipole pattern is a product of greenhouse warming, or coincidental to it. The surface area decreases the first 10 days of July were astounding---that combined with the low ice volume leads me to give 50-50 odds that arctic sea ice area reaches a new record low summer minimum.
I've been gathering notes for a sea level rise entry (or entries) and been having some trouble.
Dr. J. H. Mercer published a paper in Nature in 1978 in which he hypothesized that the West Antarctic Ice Sheet has a weak underbelly vulnerable to melting from warmer ocean currents in a greenhouse warming world. He hypothesized Nature allows you to access papers of historical importance, and Dr. Mercer's paper is supposedly available, but the link comes up empty and I haven't been able to find another source for it.
Locally, sea level is 4"-5" higher than when I was in HS 25 years ago, and while the effect are subtle, you *can* see them if you look. Trees are dying on the west (marsh) side of the island, not from erosion, for there is none, but from rising salt content of the soil. The Marshes of Glynn have many more days when the water is high and obscures most or all the marsh grass.
I would have to say that sea level rise is the facet of global warming with which I have the greatest interest.
Michael have you thought about setting up a blog on blogspot?
ReplyDeleteLiveweather is dying by the way, it's being transferred over to a wordpress site.
I have thought of making a blog, although I don't think I would put much in it, on WU I was mostly commenting before I was banned, and I haven't signed in to LWB for months, and the last time(s) I did was just to check in on messages.
ReplyDeleteWell, maybe there are things to blog about; right now we are having a heat wave; significantly, the low so far today was 85 degrees, just one degree below the all-time record high minimum set in 1901 (forecast to be 84 tonight, the high today was also 100 for the first time this year, with more 100s next week). Also, the other day there was a localized heavy rain event with nearly 6 inches reported in the area (the airport recorded half an inch).
According to this, KSTL had a low of 85 today, and I am sure that will hold. http://www.srh.noaa.gov/data/obhistory/KSTL.html
ReplyDeleteThat's significant, the St. Louis metropolitan area has not had tremendous growth in the past 50 years. I wonder where readings were taken in 1901, someplace downtown? If so, I doubt the countryside had a low of 86. Your dewpoint is a miserable 78 too.
I toss up my weather journal on my other blogspot blog, although few others would find it interesting. JT and I have a good collaboration, but have to say droughts are boooooooring. I had a couple of good storms in June, but first part of July has been dry, dry, dry, although less hot than last summer.
WU is a total nightmare. I look there occasionally. There was a big banning of trolls today there, NRAamy and CosmicEvents, and others, but the trolls and deniers are messing with some of the kids who blog there, mass minusing the ones who post about tropical weather, some are greyed out and they are sad and mad because they don't know why they are ranked low.
Several quality bloggers have reduced their presence there, and it turned out that the reason weather456 left was because he was getting racist emails, pics of his face morphed onto pictures of blacks being lynched and stuff, and admin did very little about it.
On a more local note, Savannah has had highs of 90+ every day since May 20th. On July 3rd, Savannah broke its record for consecutive highs of 90+, with 45, breaking the old record of 44 consecutive days of 90+ set in July and August 1993. As of July 11th, the streak is 53 days. A truly remarkable record to set so early in the summer. And there is no end in sight.
ReplyDeletehttp://savannahnow.com/news/2011-07-04/savannah-breaks-heat-record#.ThvSsWFk9mM
Of course this doesn't prove or disprove global warming, but it is the kind of record we will see broken over and over in cities everywhere as global warming progresses.
Still hanging at 91 at St. Louis Lambert at midnight. If no storms come in before midnight tomorrow, this could be it!
ReplyDeleteInteresting how it was 91 with a dew point of 78 at midnight on July 11/12 at Lambert Field with the temperature falling to 82, but the temperature the night before was 89 at midnight, with a dew point of 77, and the temperature only fell to 85.
ReplyDeleteGreat post on realclimate.org today about sea level rise: http://www.realclimate.org/index.php/archives/2011/07/is-sea-level-rise-accelerating/
ReplyDeleteThe NCDC report for June is interesting, with regards to satellite measured temperatures; for UAH, June was the third warmest on record for the lower troposphere, but the coldest on record for the stratosphere (for the second month), which is also consistent with (near) surface warming. The following are also significant with regards to indicating climate change:
ReplyDeleteJune 2011 was the 316th consecutive month with a global temperature above the 20th century average. The last month with below-average temperature was February 1985.
(since I was born in March 1985 that means that the global surface temperature was never below average in my entire life, although GISS has a negative monthly anomaly as recently as February 1994)
June 2011 marks the 20th consecutive June and the 121st consecutive month with below-average Arctic sea ice extent.
And speaking of Arctic sea ice extent, it is looking more and more likely that 2011 will set a new record low for July with the lead over 2007 increasing every day for the past two weeks. Of course, what happens next depends on whether the current pattern holds or not. It also helps a lot that ice extent was lower in June when insolation is at its maximum.
I'm thinking that the arctic sea ice has close to a 50-50 chance of making a record low, ice extent is lower than the same date in 2007; however ice melting in late July, August and September in 2007 was well above average. If melting reverts to the average now, it would not be enough. But there is so much more thin, one year ice or really rotten multi-year ice than there was in 2007.
ReplyDeleteThat is wild that you have never experienced the Earth with below normal temperatures.
I do not remember much out of the ordinary in February 1985, when I was a sophomore in high school. However, I do remember vividly the great freeze of Inauguration Day 1985 when St. Simons Island dropped down to 6 degrees.
You should know you have one fan who misses you on wunderground. TomTaylor's been asking about you. He posted in the climate change blog before, and was driven out--he posts good tropical weather info now, but all the thugs there have minused him into the worst category. He has since said he won't be blogging much.
I keep an eye there from time to time; I am still mentioned every day even though I haven't posted a thing in months. I get a wry sense of amusement from that.
February 1994 was a nasty weather month by Atlanta standards. January had seen a cold snap get us down to 6, but February had lots of cloudy wet days where it threatened ice but never made an ice storm.
ReplyDeleteThe winter of 1993-1994 in Atlanta was bizarre. September and early October were hot and sticky, temps well above normal. Then a wild arctic front barreled through at the end of the month and we had snow flurries all afternoon on Halloween! Sometimes it was more than flurries, it was snow showers, with significant visibility reductions. Nothing stuck anywhere, not even on car tops.
The chief difference I see between the 1970s/80s weather on St. Simons and today is how summers are. Summers are drier. And hotter.
ReplyDeleteWe used to get a couple of what were sort of like MCS every summer, that dropped down from the NE and East from off the South Carolina coast and bring us heavy rains at night, and sometimes last into the morning. The weather we had on July 15th reminded me of that, although it was not the same setup the weather on the ground felt similar.
Winters are also somewhat drier, it seems to me.
Winter lows are weaker. We used to get winter lows with pressures below 29.40 almost every winter. We have had none in 10 years.
I first started watching hurricanes with Belle in 1976, and then started tracking them in 1977.
The 1982-1983 seasons were so slow and boring! Even with Alicia. So much more to track now.
The other thing is sea level. Sea levels here are about 5" higher on tide gauges than when I was in high school. That is faster than world sea level rise. Our land here is not rising or falling, so I don't know why sea level has risen here more than the global average. Sea level varies from place to place as directed by circulation patterns.
ReplyDeleteThe effects here are subtle, but I can see them. St. Simons Island and the nearby Little St. Simons and Sea Island are experiencing net deposition and land building. The Altamaha River is the second largest river by volume on the Atlantic USA coast, and deposits considerable sediment. While there are local places where erosion takes place, they are vastly outnumbered by areas where land formation takes place, sandbars transforming into sand dunes, with bushes and oaks growing between the dune crests.
However, on the back side of the islands, where surf and erosion is not an issue, you can see trees dying as salt water advances inward. Also the Marshes of Glynn between the island and mainland have standing water covering or nearly covering the marsh grass far more frequently than it did when I was a kid growing up here.
When the marshes are dry, as they usually are, it almost seems like St. Simons Island is part of the mainland, just separated by some rivers.
When the marsh is full, with whitecaps and little visible grass for 4 miles, then St. Simons Island seems far more isolated and vulnerable. Looking west across 4 miles of water is a different experience.
Old King Coal extends his grip: http://dotearth.blogs.nytimes.com/2011/07/14/biggest-coal-company-and-coal-country-collaborate-on-mega-mine/
ReplyDeleteOne has to love what Watts says at the end of his submission to the SEARCH Arctic minimum forecast (one also wonders why they let random people like Watts submit forecasts):
ReplyDeleteEstimate of Forecast Skill: none
http://www.arcus.org/files/search/sea-ice-outlook/2011/07/pdf/pan-arctic/wuwt_panarctic_july.pdf
Also, the NWS is now forecasting lows nearing the mid-80s in the middle of the week, so a all-time record high minimum temperature just could happen this time. Interestingly, forecast highs are still more than 10 degrees below the all-time record of 115; lows have been increased from earlier but not highs. Of course, the 115 and similar reading likely occurred during dry years, and 1954 did have a major drought in the region, not like the humid heat of recent years; 2011 was even ahead of 2008 for a while earlier (i.e. the wettest year to date period on record).
Low of 82 again in St. Louis. I wonder how many lows of 80+ you'll have this year!
ReplyDeleteGreat to see this post found really understanding about global warming, I get another blog related to Global Weirding News and Global Warming Newswhich have almost every news links for global warming.
ReplyDelete