Dr. Charles Keeling was born in Scranton, PA on April 20, 1928. A precocious child, he obtained his B.S. in chemistry from the University of Illinois in 1948 at age 20, and earned his PhD in chemistry from Northwestern University in 1954.
Dr. Keeling had many interests---he was an accomplished piano player and loved hiking and camping in the mountains of California, when he moved he moved after obtaining his doctorate. He was a postdoctorate fellow in geochemistry at the California Institute of Technology from 1954-1956, where he developed new instruments which for the first time could measure carbon dioxide in the atmosphere in parts per billion. His instruments were later supplanted by the electron capture dectector invented by Dr. James Lovelock in 1957, which was adopted worldwide for sampling in the 1960s.
In 1956 he was invited to join the Scripps Institution of Oceanography by Dr. Roger Revelle (q.v.)
Dr. Revelle said about Dr. Keeling "He's a peculiar guy. He wants to measure CO2 in his belly...and he wants to measure it with the greatest precision and the greatest accuracy he possibly can.". Keeling had taken his instruments to sites in the Sierra mountains, but there were problems. When the wind shifted so that the sites were downwind of major cities like San Francisco and Sacramento, the concentrations rose sharply. What Dr. Keeling needed was a pristine site, thousands of miles away from large cities and industrial concentrations.
The 1950s and 1960s were a golden age for scientific research. The impetus of the Cold War, and unprecedented prosperity and rising wealth stimulated large and increasing research budgets. The International Geophysical Year of 1957-1958 (IGY) further augmented research budgets. Climate change, much less anthropogenic global warming, was not a big priority with the IGY, but Dr. Revelle made funds available for Dr. Keeling to make his carbon dioxide observations at the Mauna Loa Observatory, beginning March 1, 1958. Dr. Keeling also supervised a carbon dioxide sampling program from the new Antarctic bases established during the IGY.
Mauna Loa was an ideal site for Dr. Keeling's measurements. It was far from any population concentration, and the site being over 11,000' in elevation placed it above the inversion in the atmosphere that separates the low level moist trade winds from the middle levels of the atmosphere, reducing anthropogenic influences even further.
Continuous carbon dioxide monitoring was a new idea. Before discussing it with Dr. Keeling, Dr. Revelle had envisioned sampling carbon dioxide at various pristine sites around the world during the IGY, and then a new sample program comparing the IGY readings to observations made during a subsequent sampling program ~ 20 years later, say in 1980. And the Antarctic observations were dropped in the year or two after the IGY. Scientific research budgets were large and rising, but not unlimited, and atmospheric carbon dioxide measurements were not the highest priority. And as we shall see, there were serious threats to cut off the Mauna Loa measurements in the 1960s, before the importance of the measurements was fully appreciated by the scientific community.
Dr. Keelings measurements soon showed that carbon dioxide was accumulating in the atmosphere. Dr. Revelle had been proven correct--the buffer mechanism he had proposed that prevented the oceans from absorbing all the CO2 humankind was emitting was making a measurable difference in atmospheric concentrations!
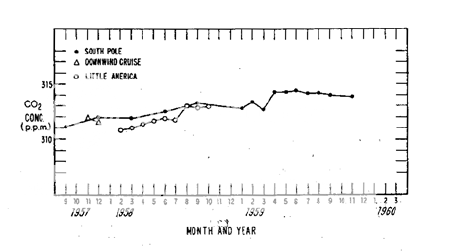
Dr. Keeling published his preliminary findings in the June 1960 of Tellus in the article "The Concentration and isotopic abundances of carbon dioxide in the atmosphere" This article contains the graph I embedded below:
Two years wasn't much though. After all, there could be some sort of atmospheric cycle going on. Today we know that is ridiculous, and we can safely dismiss the denier cranks who make that argument, but 50 years ago it was still a reasonable position. Dr. Revelle continued funding Dr. Keeling's carbon dioxide measurement program, but outside events intervened. A stock market 'crash' in the spring of 1962 wiped out more than a quarter of stocks' value---the market soon recovered, but there was a disruption to the Scripps Institution's endowment. Also in the early 1960s there was a sort of pause in the growth of budgets for scientific research, and increasing amounts were being absorbed by NASA. There were waves of growth in scientific research funding in the late 1950s and the mid 1960s, but the early 1960s saw something of a pause. And most important of all, no research agency considered Dr. Keeling's carbon dioxide measurements truly compelling---the measurements were interesting, yes, but not enough for an agency or institution to fund themselves. And the Mauna Loa Observatory was relatively isolated---an advantage in obtaining pristine atmospheric carbon dioxide measurements---but a disadvantage in that it was expensive to supply and operate.
Dr. Revelle was able to divert some funding to keep Dr. Keeling's measurement program going through 1963, and by late in that year had some promising indications of permanent funding from the National Science Foundation. (NSF) But in January 1964 the money ran out. Carbon dioxide measurements at Mauna Loa Observatory stopped.
This triggered a reaction in the scientific community--Dr Keeling's carbon dioxide series was suddenly appreciated much more in its absence!--and the NSF quickly approved permanent funding. After a 3 month hiatus in February, March, and April 1964, the Mauna Loa measurement program was resumed on May 1, 1964, and has continued to the present day.
As I said before, some scientists looked at the first 2 years of data from the Antarctic stations and Mauna Loa with legitimately skeptical eyes. The ENSO cycle was not well known 50 years ago (which does affect carbon dioxide concentrations in the atmosphere, particularly in the Pacific), but a cycle was plausible. However, as the measurement program went on, and carbon dioxide continued to increase its concentration in the atmosphere every year, such skepticism, never widely held, fell by the wayside. Since the mid 1960s, no reputable meteorologist, climate scientist, or physicist has denied that humankind's emissions are driving the atmospheric carbon dioxide increase. By the mid 1960s, the increase was undeniable. The following graph shows how carbon dioxide concentrations were increasing through the mid 1960s.
Note the funding hiatus in 1964. Mind the gap!

The importance of Dr. Keeling's measurements of atmospheric carbon dioxide cannot be overstated. Dr. Revelle showed that the oceans would not absorb all the carbon dioxide humankind emitted. Dr. Plass proved that increases in the concentration of carbon dioxide in the atmosphere would increase infrared radiation absorption. And Dr. Keeling proved that carbon dioxide concentrations were increasing, in a measurable and significant amount. As these facts disseminated through the scientific community, the scientific consensus swung decisively to the reality of anthropogenic global warming by the mid 1960s, and has remained so.
An aside here---it is frequently asserted by deniers that meteorologists and climate scientists believed in global cooling in the 1970s. This is utterly false. An analysis of peer-reviewed articles on future climate change from the period 1965-1979 shows that predictions of anthropogenic global warming outnumber predictions of anthropogenic global cooling by more than 6 to 1 (specifically 44 to 7).
Whenever a denier claims that the scientific community was predicting global cooling in the 1970s, that denier is either ignorant, or deliberately lying.
Dr. Keeling was concerned enough about rising carbon dioxide levels to participate in a panel by the Conservation Foundation on March 12, 1963 "Implications of Rising Carbon Dioxide Content of the Atmosphere", the report issued being among the first to speculate that anthropogenic global warming could be dangerous to the Earth's biological and environmental systems. It includes on page 6: "many life forms would be annihilated" [in the tropics] if emissions continued unchecked in the upcoming centuries. They also projected that carbon dioxide emissions could raise the average surface temperature of the earth by as much as 4°C during the next century (1963-2063)
Rising concern was also brought forth in 1965 when the President's Science Advisory Committee formed a panel to address environmental issues, including a climate change sub-panel. The 1965 meeting and report of this panel will be the subject of a future blog entry.
Dr. Keeling did have a monomania concerning carbon dioxide, but it was a productive monomania. Dr. Keeling was made professor of oceanography at the Scripps Institute in 1968, and received many honors for his scientific work. A short list of some of the honors he received:
Second Half Century Award of the American Meteorological Society, 1981
Maurice Ewing Medal of the American Geophysical Union, 1991
Blue Planet Prize from the Science Council of Japan and the Asahi Foundation, 1993
National Medal of Science, by George W. Bush in 2002
Tyler Prize for Environmental Achievement in 2005 (shared with Lonnie Thompson)
Dr. Keeling married Louise Barthold in 1955, and they had 5 children. One of whom, Dr. Ralph Keeling, is a climatologist at the Scripps Institute himself, following in his father's footsteps. Dr. Ralph Keeling is the current director of the Scripps CO2 Program.
Dr. Keeling was a lifelong Republican, of a type we don't see much of anymore--a Republican with a strong concern for the environment and science. Dr. Keeling deeply regretted and was disappointed by the politicization of science, and the abandonment of science by the large parts of the Republican party during the last two decades of his life. When ideology and scientific fact conflict, it should be the ideology that changes--because the facts will not. Dr. Keeling continued his measurements of carbon dioxide until he died of a heart attack on June 20, 2005.
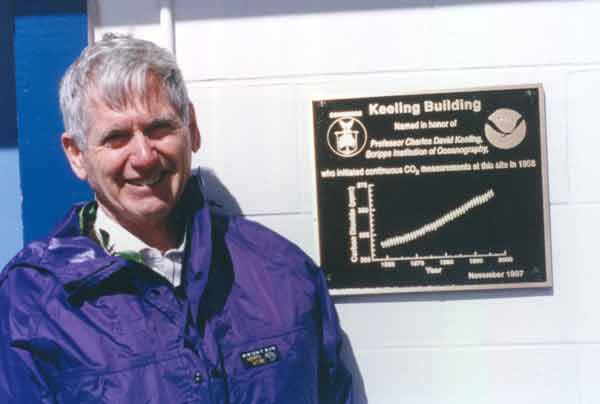
A picture of Dr. Charles Keeling in 1997:
Here is the latest Keeling Curve, with the full record of carbon dioxide levels in the atmosphere:

A report released today (May 30, 2011) by the IEA reports that our CO2 emissions reached a new record in 2010, 30.6 billion tons. CO2 emissions in 2010 were 5% higher than the previous record in 2008.
I'm having a very hard time finding a good image of Dr. Keeling's preliminary graph. There are several of this, but they are all so small! 67 x 140. Too small to see well when embedded at actual size, and blurry and ugly when enlarged. John or Michael, if you run across a bigger graph, please let me know!
ReplyDeleteDr. Lonnie Thompson is a fascinating character. He has probably done more field research for climate and atmospheric studies than any other scientist. He is worthy of a long blog entry (a long book, actually), but his work is interdisciplinary and hard to summarize. But I'll see.
ReplyDeleteThe Boulder 1965 climate conference will be my next blog entry.
Global warming can be blamed for a lot, but not this. Al Roker did a great disservice on the Today show on May 25th: http://dailycaller.com/2011/05/23/nbcs-al-roker-climate-change-bringing-tornadoes-to-urban-areas/
ReplyDeleteThis comment has been removed by the author.
ReplyDeleteI wish I knew how to do that properly.
ReplyDeleteThe Economist has a very interesting lead article released on line today and in print next week.
http://www.economist.com/node/18744401?Story_ID=18744401
And another article about the Anthropocene in the same issue: http://www.economist.com/node/18741749?story_id=18741749
ReplyDeleteThat was a good read. Ill get the graphs for you and post a link.
ReplyDeleteThis comment has been removed by the author.
ReplyDeleteThanks John, you're really helpful!
ReplyDeleteI added george monbiot to my blog list - he has been reviewing arguments for and against nuclear and its quite interesting :
ReplyDeletehttp://www.monbiot.com/2011/04/04/evidence-meltdown/
http://www.monbiot.com/2011/04/13/why-this-matters/
In another story today (May 30, 2011), Germany announced that it will shut all nuclear plants by 2022. Backwards, ever backwards. http://www.bbc.co.uk/news/world-europe-13592208
ReplyDeleteGerman PV -
ReplyDeleteIn 2009, PV systems contributed 6,578 GWh to German electricity production. ( http://www.germanenergyblog.de/?p=4249 )
PV generation fed into the grid in 2011 was assumed to be 19,399 GWh.
in 2010, --which have a nameplate capacity of 4.5 GW--produced 29,221 GWh of power generation. ( http://theenergycollective.com/breakthroughinstitut/54322/doing-math-comparing-germanys-solar-industry-japans-fukushima-reactors )
Even at theoretical peak with ALL new instillation the in the 20 year solar network that Germany installed up through 2011 would not replace Fukushima.
Im doing a blog on it needless to say.
ReplyDelete